Managing Zentyal
Zentyal does not only allow to configure network services in an integrated manner, but it also offer a series of features that ease server administration and maintenance.
One of the most basic maintenance tools integrated in the Zentyal Server are the Logs. In case of errors or unexpected events, these provide us information of what happened and when, helping us to resolve the incidents. This module has been described in detail in the “Introduction to Zentyal” chapter.
This section will go into detail about the most important logs and commands for resolving incidents. Information about useful commands for the Zentyal Server administrator is also included, along with tips and good practices on how to carry out the upgrade from an earlier Zentyal version.
In addition to the maintenance tools integrated in the Zentyal Server, the Commercial Edition offers a set of services that help automate the maintenance and management tasks of your server. These services are available through the graphical interface of the Commercial Edition of the Zentyal Server.
Smart Admin
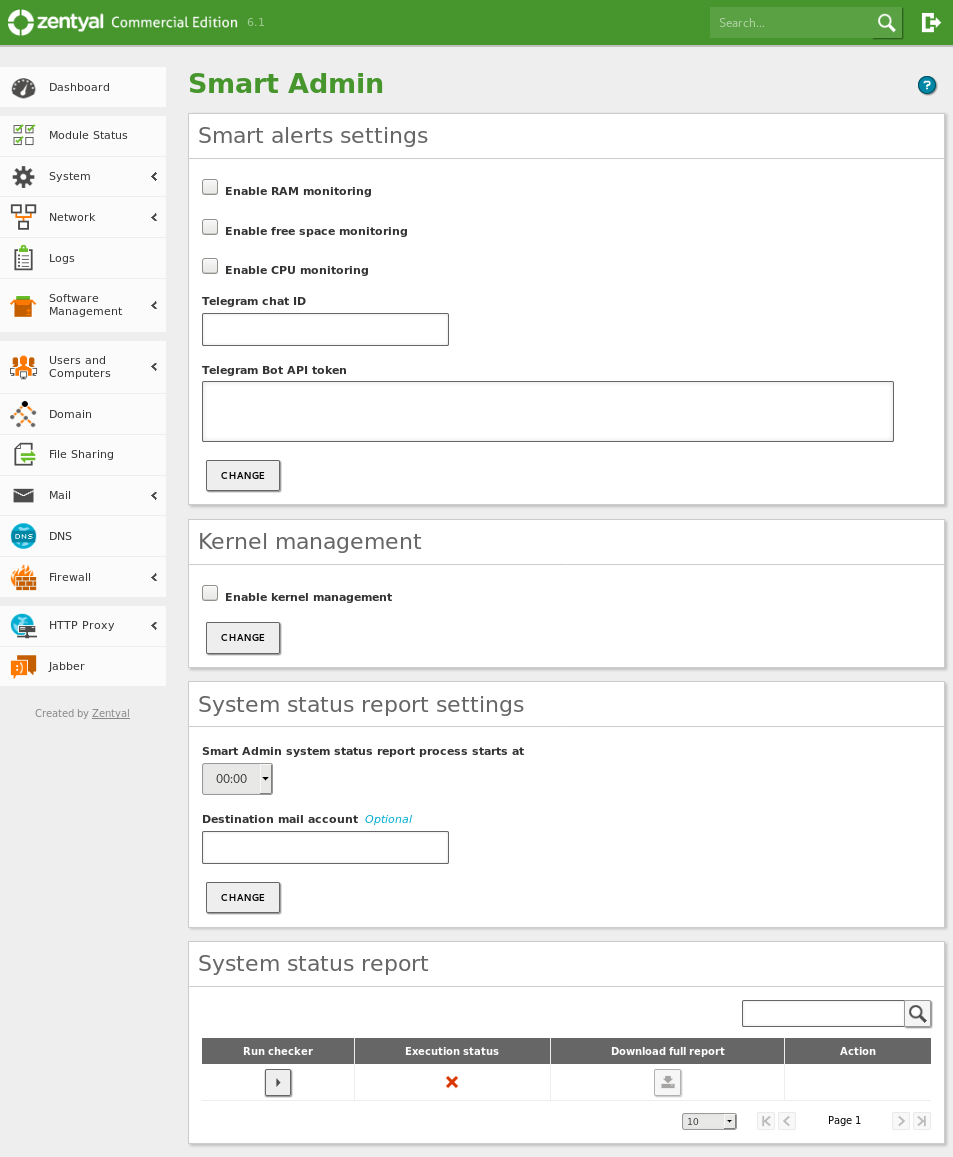
Zentyal 6.1 adds the following new features that will help you to manage your server. These features are available through the GUI in System -> Smart Admin in the commercial versions. In the Zentyal Development edition these features are made available through scripts located in the /usr/share/zentyal.
The new features are:
- Automatic alerts to a Telegram group regarding the usage of server resources: CPU, RAM and disk.
- Management of old kernels installed on Zentyal.
- Automatic reporting of relevant aspects of your Zentyal server.
New features available
Smart alerts
This feature allows you to receive alerts to a Telegram group [1] as soon as one of the resources exceeds the defined alert threshold.
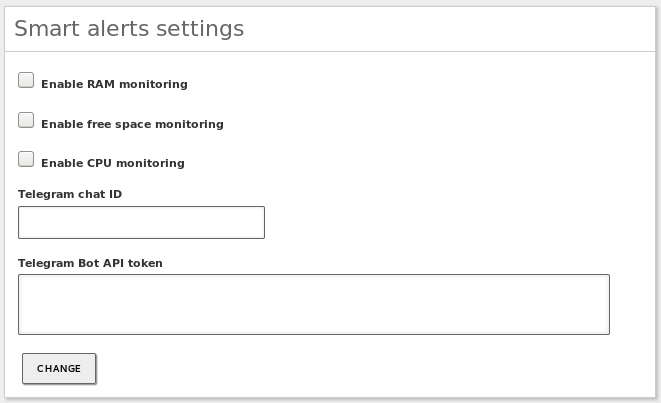
Alert configuration
Enable RAM monitoring:
Enables the RAM monitoring. The alert will be sent in case the available RAM will be less than 30%. The checks will be run every two minutes.
Enable free space monitoring:
Enables the monitoring of free space on partitions mounted on the Zentyal server. The alert will be sent in case any of the partitions has less than 30% of space available. The checks will be made every hour.
Enable CPU monitoring:
Enables the CPU monitoring. The alerts will be sent in case the CPU load of the last minute exceeds 80%. The checks will be made every three minutes.
Telegram Chat ID:
ID of the Telegram chat where the notification will be sent.
Telegram Bot API token:
The Telegram Bot API token that will send the notifications to the Telegram group.
| [1] | Telegram API: https://core.telegram.org/ |
Examples of the alerts
Below you can see examples of the alerts received on Telegram:
RAM alert:
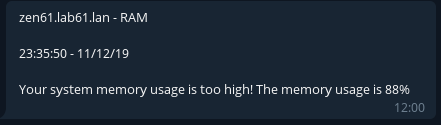
RAM alert on Telegram
Free available space alert:
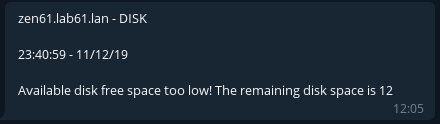
Available disk space alert on Telegram
CPU alert:
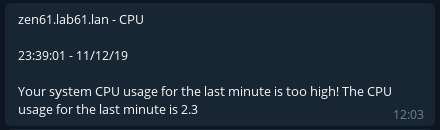
CPU alert on Telegram
Kernel management
In general, GNU/Linux systems store the successive kernel versions. Eventually the /boot partition can run out of storage space and prevent the normal operation of the package system. This new feature allows Zentyal to manage the number of kernels installed in the system by configuring a ‘queue’ that stores only the three latest kernels.
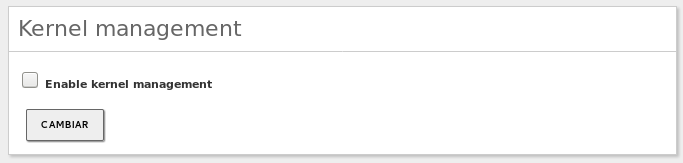
Enable kernel management
System status reports
The last of the added features allows you to generate detailed reports of the most important operating parameters of the server and the enabled modules. Additionally it is also possible to send the reports by email. Some of the data provided by Smart Admin are:
- Installed Zentyal modules and their status.
- CPU, RAM and SWAP usage.
- Broken packages and packages available for upgrade.
- Number of errors in the Zentyal modules.
- Access attemps to the different services.
- Information about the Domain Controller and File Sharing.
- Information about the e-mails managed by the Electronic Mail Service (SMTP/POP3-IMAP4) module .
Through the graphical interface you can configure the time when the report is generated and where it will be sent automatically by email, once a day. You can also generate a report manually at any time and download it through the graphical interface.
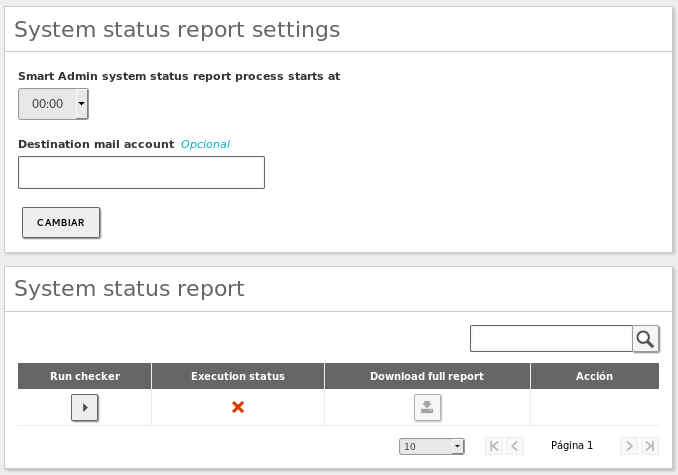
Configuration of the Smart Admin report
Troubleshooting
Unfortunately, like with any other system, at some point you will experience some incident or anomaly with Zentyal. That is why it is extremely important to be familiar with the log files that can provide you with the clues to debug the issues and correct them.
Main log files
Below you have a list of the most important log files of Zentyal.
SSH access attemps:
/var/log/auth.log
Zentyal modules status:
/var/log/zentyal/zentyal.log
System and daemons logs:
/var/log/syslog
Installed software:
/var/log/zentyal/software.log
/var/log/dpkg.log
Domain Controller logs:
/var/log/samba/samba.log
Mail module logs:
/var/log/mail.log
/var/log/mail.err
SOGo logs:
/var/log/sogo/sogo.log
OpenVPN module connections logs:
/var/log/openvpn/
Proxy module logs:
/var/log/squid/
Jabber module logs:
/var/log/ejabberd/
Main commands
Besides being familiar with the logs that store the executed server and service events, it is important to know the commands that allow you to debug the system. Below you can find a list of the most common and useful commands:
Broken packages:
dpkg -l |egrep -v '^ii|rc' | awk '{if(NR>5)print}' .
Network outages:
grep 'Link is Down' /var/log/syslog
Samba database errors:
samba-tool dbcheck --cross-ncs
Zentyal module status and status of the daemons:
zs dns status
systemctl status bind9
journalctl -u bind9
MySQL databases status:
mysqlcheck -u root -p$(cat /var/lib/zentyal/conf/zentyal-mysql.passwd) --all-databases
Blocked processes:
lslocksGPOs applied and not applied to a Windows client belonging to the domain:
gpresultReport of the GPOs applied and denied for a given client:
Through the Microsoft RSAT in the 'Group Policy Results' menu
Finally, it is important to know where to look for additional information in case of failures. The following links are especially useful in relation to the Domain Controller module:
- How to verify the directory replication statuses: https://wiki.samba.org/index.php/Verifying_the_Directory_Replication_Statuses
- How to Determine a DCs objectGUID: https://wiki.samba.org/index.php/Verifying_and_Creating_a_DC_DNS_Record#Determining_a_DCs_objectGUID
Useful commands
Like any computer system, Zentyal must be checked daily to ensure its stability. If possible, keep your server monitored by Zabbix [2] or Nagios, etc. These systems will notify you when your Zentyal server is experiencing any incident or anomaly (among other features).
It is always necessary to be familiar with a series of basic commands to obtain information from the server as well as for server maintenance. Below you can find a list of the most useful commands:
Disk status:
lsblk
df -hT
CPU workload:
htop
top -bn1 | egrep -o "load average:.*" | cut -d ":" -f2 | tr -s "," "."
RAM and SWAP use:
free -m
Network interfaces:
ip -4 a
ip route show
ping google.es
dig google.es
dig 8.8.8.8
traceroute google.es
dig @localhost zentyal-domain.lan
Available updates:
apt-get update && apt list --upgradable
Scheduled tasks executed:
grep 'cron' /var/log/syslog
Rejected e-mails:
egrep 'status=(reject|bounced)' /var/log/mail.log
| [2] | Zabbix configuration to monitor Zentyal in https://wiki.zentyal.org/wiki/Zentyal_server_monitoring_with_Zabbix |