Logs
Zentyal log queries
Zentyal provides an infrastructure that allows its modules to log all types of events that may be useful for the administrator. These logs are available through the Zentyal interface. Logs are stored in a database so making queries, reports and updates is easier and more efficient. The database manager used is MySQL.
You can also configure different dispatchers for the events so that the administrator can be notified in different ways (Email, Jabber or RSS [1]).
| [1] | RSS Really Simple Syndication is an XML format used mainly to publish frequently updated works http://www.rssboard.org/rss-specification/. |
Zentyal offers logs for the following services:
- OpenVPN Virtual private network (VPN) service with OpenVPN
- SMTP Filter Mail filter
- Printers Printers sharing service
- Firewall Firewall
- DHCP Network configuration service (DHCP)
- Email Electronic Mail Service (SMTP/POP3-IMAP4)
- HTTP Proxy HTTP Proxy Service
- Shared files File sharing and Domain Services
- IDS Intrusion Prevention System (IDS/IPS)
You can also receive notifications of the following events:
- Specific values in the logs.
- Zentyal health status.
- Service status.
- Events of the RAID subsystem per software.
- Free disk space.
- Problems with the outgoing Internet routers.
- Completion of a full data backup.
To start with, to be able to work with the logs, just like with any other Zentyal module, you must make sure that the module has been enabled.
To enable the module, go to Module status and check the logs box. To obtain reports from the existing logs, you can go to the Maintenance ‣ Logs ‣ Query logs section via the Zentyal menu.
You can obtain a Full report of all log domains. Moreover, some of them provide an interesting Summarised Report; giving you an overview of the service during a time period.
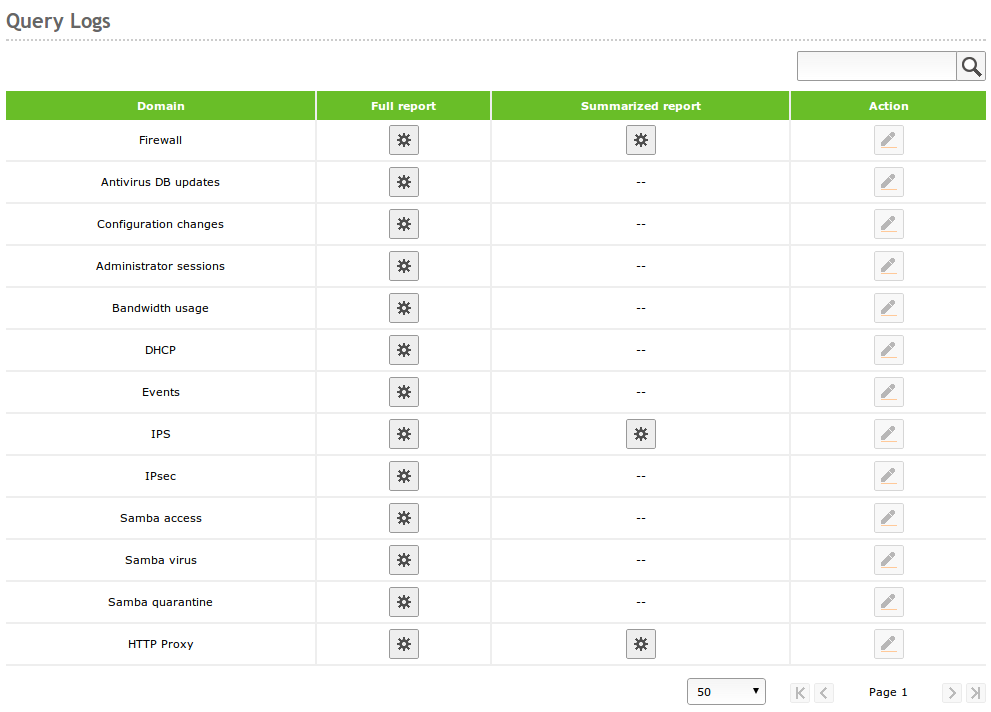
Query log screen
In the Full report you have a list of all registered actions for the selected domain. The information provided depends on each domain. For example, for the OpenVPN domain you can see the connections to a VPN server of a client with a specific certificate or for example, for the HTTP Proxy you can see the pages denied to a specific client. Therefore, you can create a customised query which allows you to filter by time period or other values that depend on the type of domain. You can store these queries as events so that you will be notified when a match occurs. Furthermore, if the query doesn’t have an upper time limit, the results will automatically refresh with new data.
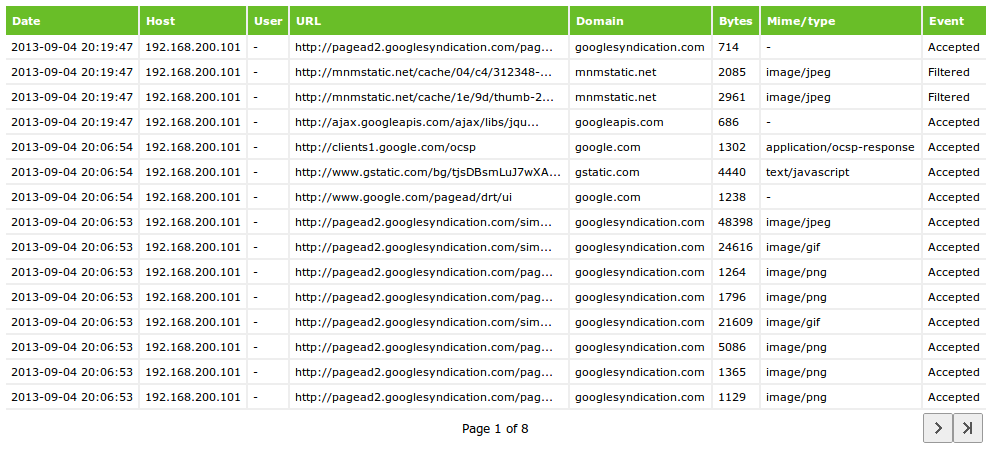
Full report screen
The Summarised reports allow you to select the time period of the report, which may be one hour, one day, a week or a month. The information you obtain is one or more graphics, together with a summary table with total values of different data types. In the image you can see, for example, daily request statistics and daily HTTP Proxy traffic.
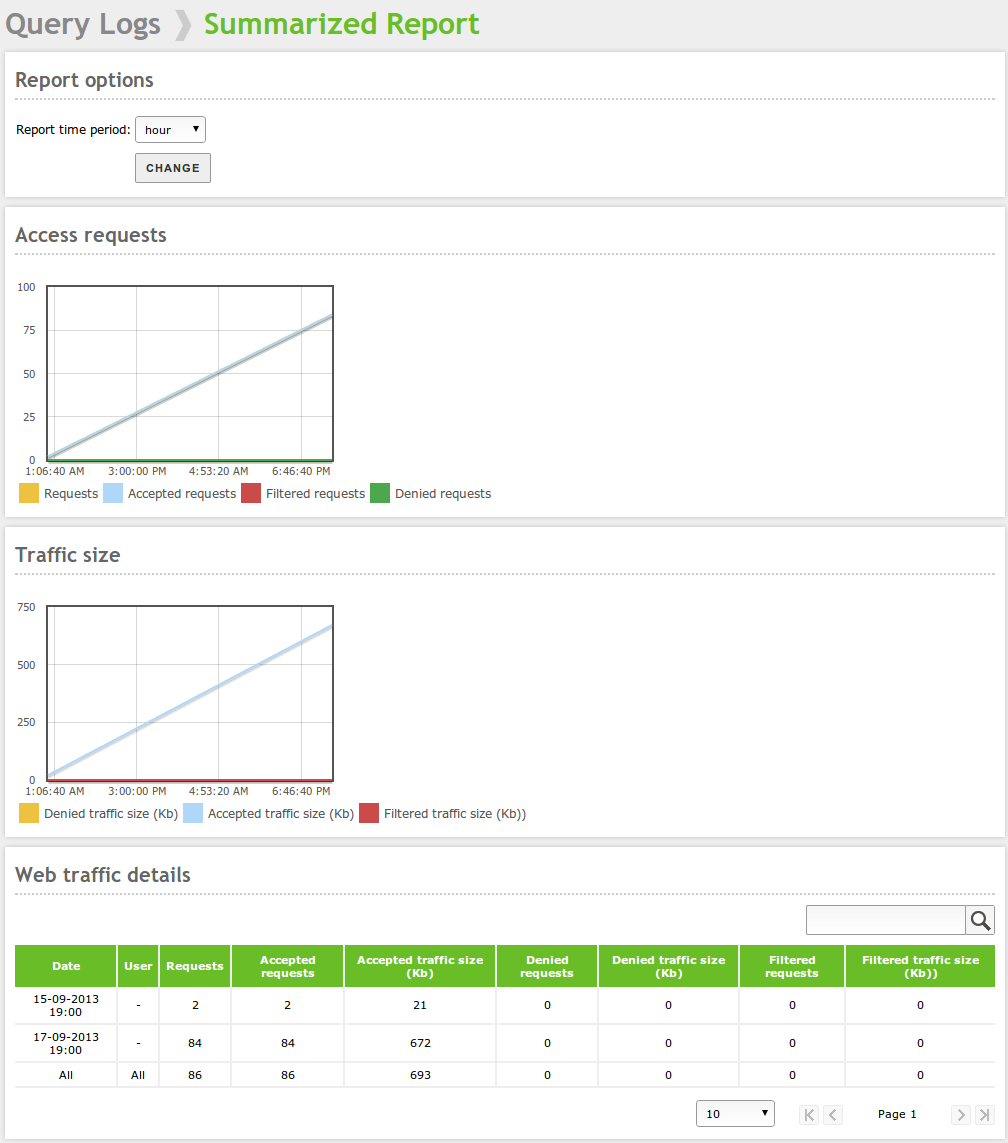
Summarised report screen
Configuration of Zentyal logs
Once you have seen how to check the logs, it is also important to know that you can configure them in the Maintenance ‣ Logs ‣ Configure logs section from Zentyal menu.
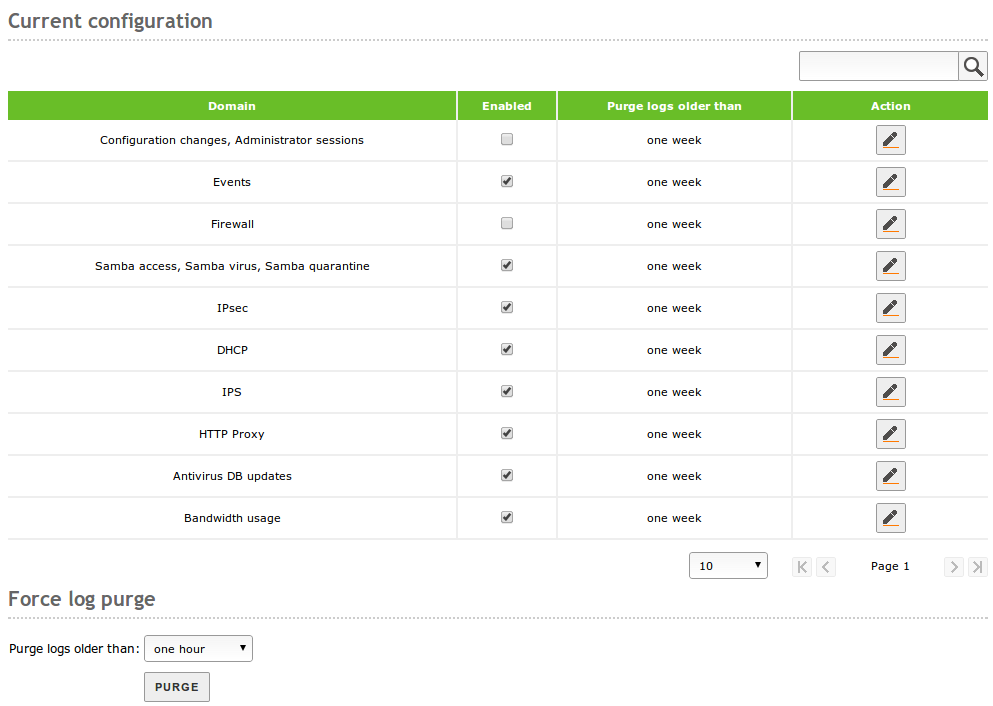
Log configuration screen
The values you can configure for each installed domain are:
- Enabled:
- If this option is not enabled, no logs are written for this domain.
- Purge logs older than:
- This option establishes the maximum time during which the logs will be saved. All the values that are older than the specified time will be discarded.
In addition, you can also force the instant removal of all the logs before a certain time period. You can do this by clicking on the Purge in the Force log purge section. This allows selection of different intervals, ranging from one hour to 90 days.
Log Audit for Zentyal administrators
In addition to the logs available for the different Zentyal services, there are two other log registries not associated with any of the services, but rather with the Zentyal’s administrative panel itself. This feature is specially useful for servers managed by more that one person, since you have a stored log of the successive configuration changes, and executed actions for each user, with their associated timestamps.
By default, this feature is disabled. If you want to enable it, you just have to go to Maintenance ‣ Logs ‣ Configure logs and enable the Configuration changes, Administrator sessions domain, as explained in the former section.

Setting up audit log
Once you have saved these changes, go to Maintenance ‣ Logs ‣ Query logs to see the following two tables:
- Configuration changes: Here you can see the module, section, type of event, and current and former changes (if applicable) for all the configuration changes made after the audit log was enabled.
- Administrator sessions: It contains the information related with all the administration login attempts, successful or not, session log outs and expired sessions for the different users, with their associated IP addresses.
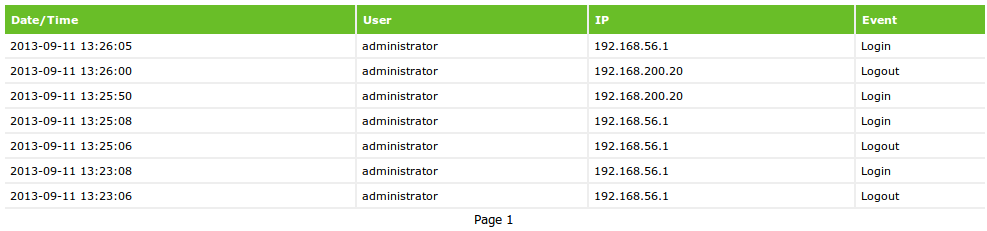
Query administration logs
Since there are some actions in Zentyal that take effect instantly, like restarting a server, and some others that are not applied until you save the changes, like most of the configuration changes, the audit log treats them in a different way. The instant actions will be logged permanently (until the registry is purged) and the ones pending to save will be displayed in the save changes interface itself, offering the system administrator a summary of all the modifications since the last save point, or, in case you want to discard changes, the actions will be removed from the log.
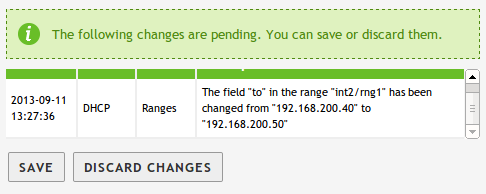
Logs saving changes