Logs
Zentyal log queries
Zentyal provides an infrastructure that allows its modules to log all types of events that may be useful for the administrator. These logs are available through the Zentyal interface. Logs are stored in a database so making queries, reports, and updates is easier and more efficient. The database manager used is MySQL [1].
Zentyal module provides records for the following services, called ‘domains‘:
- Configuration changes and Administrator sessions
- Firewall (Firewall)
- DHCP (Network configuration service (DHCP))
- OpenVPN (Virtual private network (VPN) service with OpenVPN)
- IPsec (VPN Service with IPsec and L2TP/IPSEC)
- IPS (Intrusion Prevention System (IDS/IPS))
- Proxy HTTP (HTTP Proxy Service)
- Radius (Network authentication service (RADIUS))
- Mail (Electronic Mail Service (SMTP/POP3-IMAP4))
- SMTP Filter (Mail filter)
- Samba access (Domain Controller and Directory Services)
If you want to use the logs, you must first make sure that the Logs module is enabled.
To enable the module, go to and check the Logs box. To obtain reports from the existing logs, you can go to the section via the Zentyal menu.
You can obtain a Full report of all log domains.
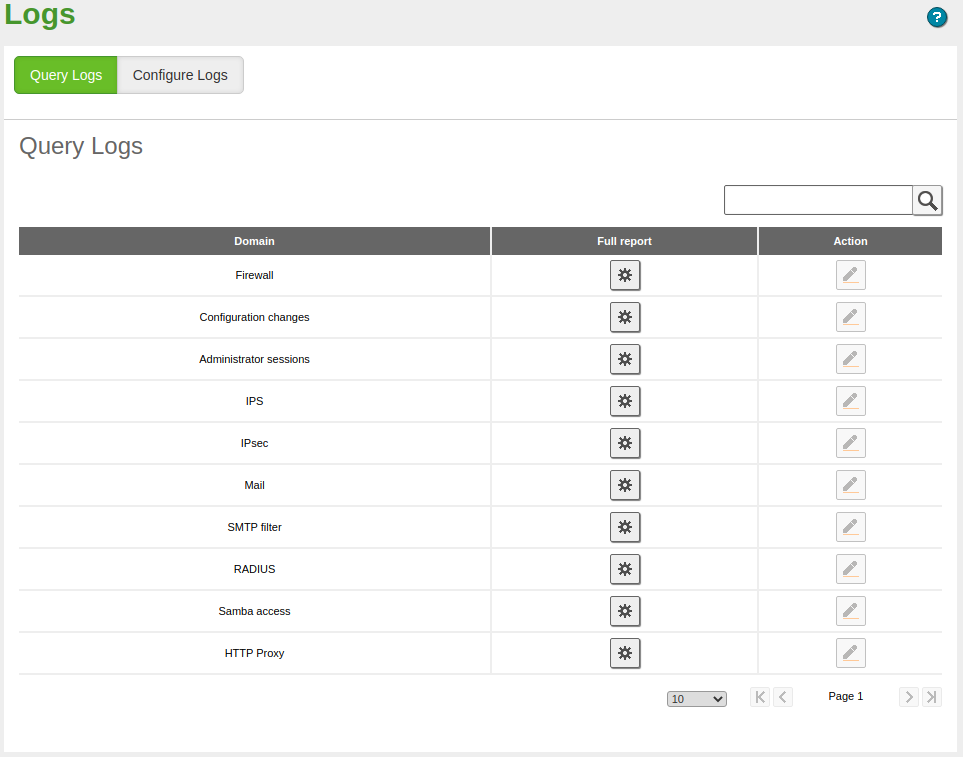
Domains available for log queries
In the Full report you have a list of all registered actions for the selected domain. The information provided and available filters depend on each domain. For example, for the OpenVPN domain, you can query the connections to a VPN server from a client with a specific certificate and filter, for example, by the connection date.
If you like, you can store these queries as events so that you will be notified when a match occurs. Furthermore, if the query doesn’t have an upper time limit, the results will automatically refresh with new data.
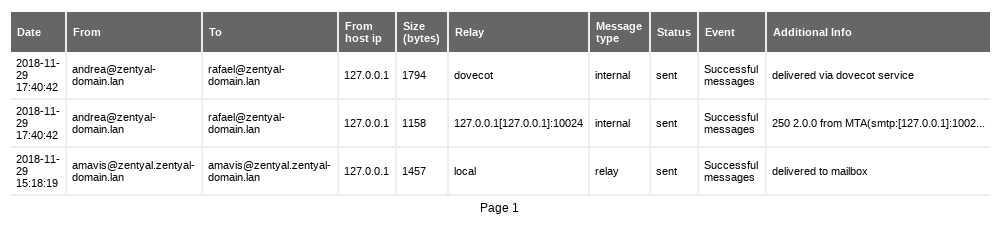
Full report screen
| [1] | MySQL: http://en.wikipedia.org/wiki/MySQL |
Configuration of Zentyal logs
Once you know how to check the logs, it is also important to learn how to configure them in the section from the Zentyal menu.
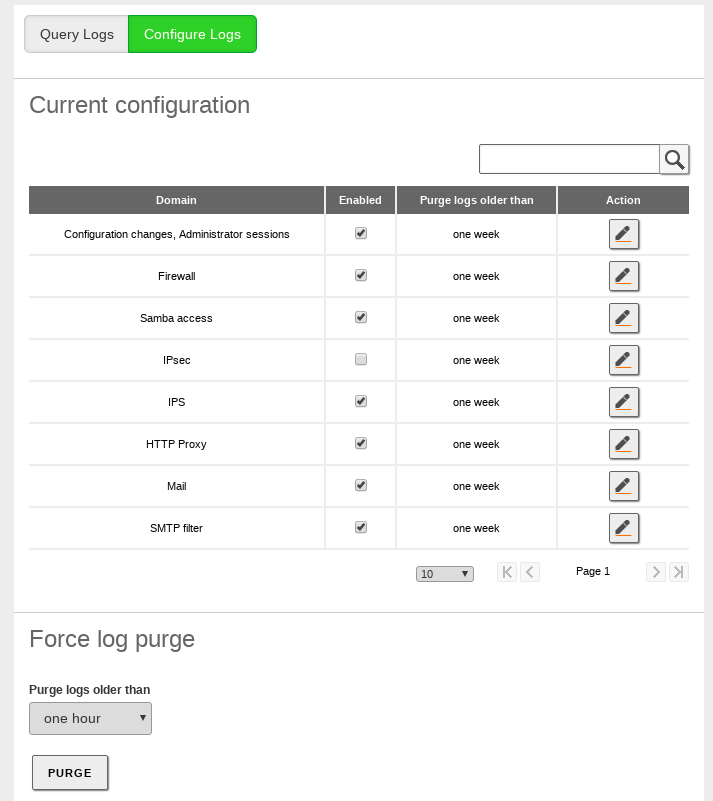
Log configuration screen
The values you can configure for each installed domain are:
- Enabled:
- If this option is disabled, no logs are written for this domain.
- Purge logs older than:
- This option establishes the maximum time during which the logs will be saved. All the values that are older than the specified time will be discarded.
In addition, you can also force the instant removal of all the logs before a certain time period. You can do this by clicking on the Purge in the Force log purge section. This allows selection of different intervals ranging from one hour to 90 days.
Log Audit for Zentyal administrators
In addition to the logs available for the different Zentyal services, there are two other logs not associated with the Zentyal’s administrative panel itself. This feature is specially useful for servers managed by more that one person since you have a stored log of the successive configuration changes and executed actions for each administrator user with their associated timestamps.
By default this feature is disabled. If you want to enable it you just have to go to and enable the Configuration changes, Administrator sessions domain as explained in the former section.

Setting up audit log
Once you have saved these changes go to to see the following two tables:
- Configuration changes: Here you can see the date on which the change was made, the user who made the change, the affected module, type of event, identifier, the new value and the previous value (if applicable).
- Administrator sessions: It contains the information related with all the administration login attempts, successful or not, session log outs and expired sessions for the different users with their associated IP addresses.
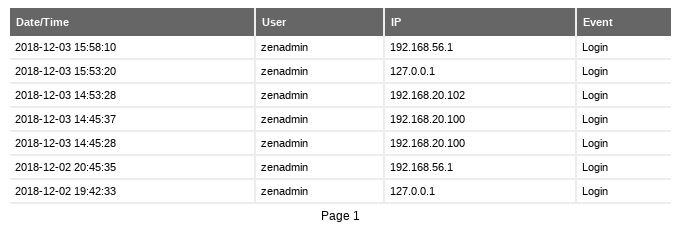
Administration logs
Since there are some actions in Zentyal that take effect instantly (like restarting a server) and some others that are not applied until you save the changes (like most of the configuration changes), the audit log treats them in a different way.
The instant actions will be logged permanently (until the registry is purged) and the ones pending to save will be displayed in the “Save changes” pop-up window. This windows provides the system administrator a summary of all the modifications since the last save point or - in case you discard changes, the actions will be removed from the log.
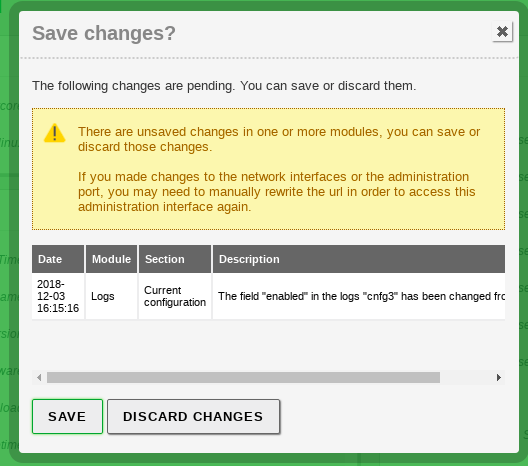
Save Changes-window